
The pricing page tells you the entry cost. It rarely tells you the exit cost.
A founder signs up for an AI writing tool at $20 a month. An engineer wires a support chatbot into the product for a few hundred dollars in a quiet pilot. Six months later the finance team is staring at an invoice that reads five figures, and nobody changed a setting. This is the part of AI adoption the marketing skips: the number you pay to start has almost nothing to do with the number you pay once real usage arrives.
This guide models the curve behind that jump. You will see why AI bills leap instead of drifting upward, which pricing model quietly turns against you at which size, the costs that never appear on a rate card, and the levers that flatten the whole thing. Read it as two lanes. If you sign the invoices, focus on the pricing and hidden-cost sections. If you build the thing driving the bill, the token and inference sections are yours.
Quick answer: AI tools cost more at scale because most AI pricing is usage-sensitive. You pay per token, per API call, or per compute hour, so the bill tracks activity, not a fixed license. A design that is cheap at low volume becomes expensive at high volume as tokens, retries, and users multiply, which is why production spend can be 10 to 50 times a pilot.
Key takeaways
● Production AI bills commonly jump 10x to 50x over a pilot in a single quarter, with nothing broken in the code.
● Per-seat pricing can cost 10 to 100 times more than usage-based above roughly 100 users when adoption is uneven.
● Prompt caching, model routing, quantization, and batch APIs each cut documented costs by 50 percent or more.
● Stanford's FrugalGPT showed up to 98 percent cost reduction from cascade routing at matched quality.
● Enterprise AI spend is growing near 40 percent a year, with an estimated 25 to 35 percent spent outside IT visibility.
The AI cost curve: why the bill jumps instead of climbing
Most infrastructure costs rise in a straight, forgivable line. AI cost does something stranger. It sits near zero, holds flat through testing, then steps up hard the moment usage becomes real. Understanding the shape of that step is the whole game, so start with the curve itself.
The three stages: prototype, pilot, production
Teams shipping AI features report a remarkably consistent escalation. A prototype runs under $50 a month. A pilot lands somewhere around $500 to $2,000. Then production arrives and the bill climbs 10 to 50 times in one quarter. Nothing failed. The same architecture that was cheap serving 40 test documents becomes expensive serving 40,000 live ones, because the cost curve for tokens is steeper than any other line most builders have dealt with.
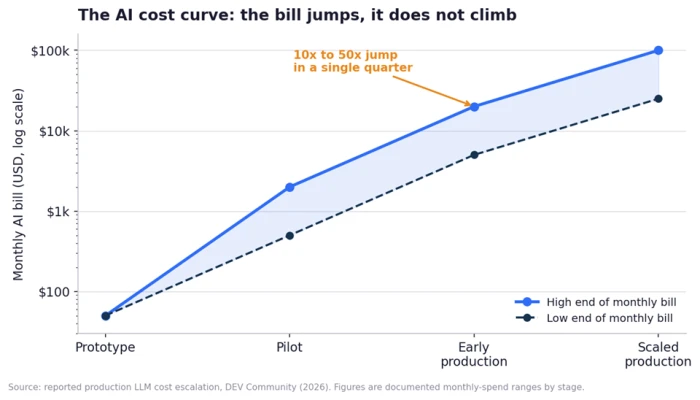
Figure 1. Documented monthly AI spend by stage. Source: reported production LLM cost escalation, DEV Community (2026).
The chart uses a log scale on purpose. On a normal axis the prototype and pilot numbers would flatten into the baseline and disappear, which is exactly the trap: the early stages feel free, so the eventual jump feels like a betrayal rather than a predictable event.
Why AI cost behaves differently from traditional software
Old-school enterprise software followed a comfortable pattern. You negotiated a contract, fixed a cost, and depreciated it over time. AI breaks that model. As the Forbes Business Council put it, token-based pricing and inference charges introduce a usage-sensitive structure that most finance and technology teams are not equipped to forecast accurately, and that challenge compounds at scale.
The mental shift: consumption is the variable now. Token prices keep falling, yet bills keep rising, because the thing you are billed for is activity, and successful products generate more activity every month.
What drives the cost when you scale
If the curve explains the shape, the mechanics explain the force behind it. This is the builder's lane. Four drivers do most of the damage, and each one is an architecture choice rather than a law of nature.
Token economics: input, output, and reasoning
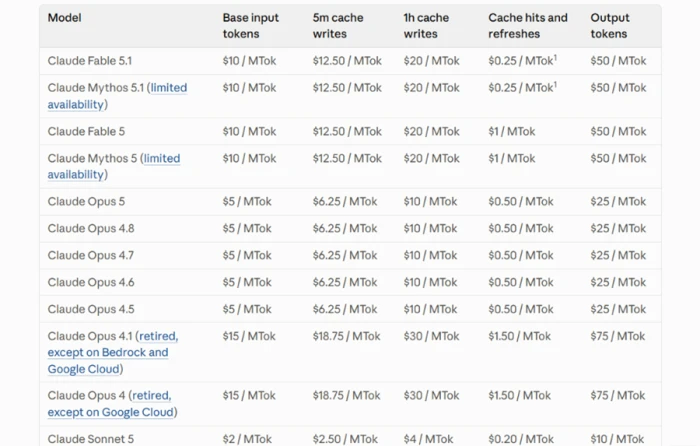
Language models do not bill per request. They bill per token, where one token is roughly four characters of English. Every call carries three kinds of token cost, and each scales differently.
The system prompt you pay for on every single call
Your system prompt is fixed text, so it feels free. It is not. That block is re-sent and re-billed on every request. A 1,500-token system prompt served across a million requests a month is 1.5 billion tokens of pure overhead before a user types a word. Trim that prompt to 900 tokens and you save 600 million tokens a month at the same traffic. The instruction never changed. The bill halved.
Output and reasoning tokens cost the most
Generation is sequential. The model produces one token at a time, each needing a full forward pass, while input is processed in parallel. Providers price that difference at roughly five times on current flagship models. Reasoning models make it worse, because their hidden thinking steps bill at output rates. Allowing a 2,000-token answer where 400 would do more than doubles your output charge instantly.
Inference and compute: the cost under the API
Behind every managed API sits a GPU you are indirectly renting. When you self-host, that cost becomes explicit and utilization becomes the number that decides everything. Cost per token is essentially the GPU hourly price divided by the tokens actually produced in that hour. A GPU running at 40 to 50 percent utilization makes your effective cost per token far higher than the headline math suggests, because you pay for the whole chip while half of it sits idle.
This is the crossover that decides build versus buy. Managed APIs win while volume is low or spiky, since you pay only for what you use. Self-hosting wins once volume is high and predictable enough to keep the hardware busy, at which point you pay for capacity instead of per token. Below that line, running your own GPUs mostly means paying premium rates to watch them idle.
Agentic AI: where one request becomes twenty
The single biggest change since 2024 is that a request is no longer one model call. An agent plans, calls a tool, checks its work, retries, then answers. Research on agentic coding tasks found that agents can consume far more tokens than plain chat, with wide variation between runs. Worse for budgeting, one team can deploy many agents without adding a single human seat, so spend scales with autonomy instead of headcount. A workflow that looked cheap per user gets expensive per task the moment you let it act on its own.
The silent bill-spikers
Cost is a lagging metric. You feel latency and errors immediately, but you see spend only when the invoice lands, which is why runaway costs run so long before anyone notices. A few patterns cause most of the damage:
● Retry storms. A retry loop hammering the API after a timeout bug.
● Context bloat. A prompt-injection attack or a bug stuffing giant contexts into every call.
● Duplicate calls. A frontend fault firing repeated inference calls for the same input.
● Quiet drift. Verbose outputs and long-context surcharges quietly lifting the per-call price.
Pricing models, and exactly where each one betrays you
You now know what generates the cost. The next question is how you get charged for it, because the pricing model you pick decides whether scale rewards you or punishes you. This is the sharpest, most avoidable mistake in the whole category.
The six models at a glance
| Pricing model | How the cost behaves at scale | Where it betrays you |
|---|---|---|
| Per-seat | Fixed per user, flat with usage | Idle licenses; punishes low adoption |
| Usage / token | Rises linearly with activity | Least predictable; spikes with traffic |
| Tiered | Steps up at thresholds | Cliff jumps between packages |
| Hybrid (seat + usage) | Moves with both seats and use | Hardest of all to forecast |
| Outcome / agent | Per resolution or per action | Can outrun headcount fast |
| Self-host | Fixed GPU capacity cost | Wasted spend at low utilization |
Table 1. Sources: Zylo, Zuora, and CloudZero pricing-model breakdowns (2026).
The per-seat trap: paying for licenses nobody opens
Per-seat pricing is the easiest line item to approve and the easiest to overbuy, because a predictable price makes it simple to add seats faster than adoption justifies. The math turns ugly when usage is uneven, and usage is always uneven.
Worked example. A 60-person firm bought a per-seat AI assistant at $80 a seat. Year-end data showed 12 of the 60 seats drove 95 percent of the value. The firm was paying about $46,000 a year for usage worth roughly $9,000 if priced honestly. The fix was a hybrid renegotiation: a lower base seat plus per-conversation overage for the power users. Source: Korix AI pricing analysis (2026).
The lever to watch is effective cost per active user, not list price per seat. At 500 users on a $30 seat, you commit to $180,000 a year. If only 40 percent are active, your real cost per active user is about $75, more than double the sticker.
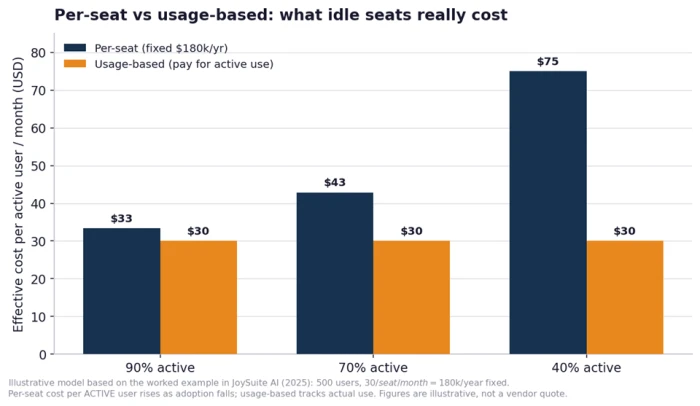
Figure 2. Effective cost per active user as adoption falls. Illustrative model based on JoySuite AI (2025).
Usage-based and hybrid: predictable until it is not
Usage-based pricing rewards you for low-utilization staff and charges heavy users fairly, which makes it the cheaper shape when fewer than roughly 70 percent of your licensed people are active. The catch is forecasting. A single popular feature can double your bill in a month with no one touching a config. Hybrid pricing, now the direction most AI vendors are moving, layers a base fee under usage charges, so your invoice moves with two independent variables that rarely move together.
Which model fits your usage shape
The decision is not about which model is cheaper in the abstract. It is about whether your usage is concentrated or spread, and whether your team can manage an API. Two clean rules cover most cases. If under 70 percent of licensed staff would be active, usage-based usually wins. If 90 percent or more are active every day, per-seat economics start to make sense again.
The hidden costs nobody quotes on the pricing page
Even a perfectly chosen pricing model covers only the visible bill. A second set of costs hides in implementation, operations, and risk. These rarely sit in one budget line, which is what makes them dangerous.
Integration, data, and maintenance
Deploying a model is the start, not the finish. You integrate it with your CRM, your app, and your workflows, which usually means custom API work. Models drift as real-world data shifts, so retraining or updates land every few months. You add monitoring for accuracy and guardrails for compliance. Together these ongoing tasks add roughly 15 to 30 percent of the initial project cost per year in maintenance alone. A $99-a-month writing assistant can become a $2,500 first-year commitment once setup hours, training time, and quality checks are counted.
The hidden cost stack
| Hidden cost | When it shows up | Typical magnitude |
|---|---|---|
| Data cleanup and labeling | Before deployment, then ongoing | Weeks of engineering per dataset |
| Integration / API work | During rollout | Often exceeds first-year license |
| Maintenance and retraining | Every 3 to 6 months | 15 to 30% of project cost per year |
| Monitoring and guardrails | Continuous once live | Recurring platform plus staff time |
| Idle / over-provisioned compute | After scaling | $500 to $23,000 a month even at low traffic |
Table 2. Sources: DesignRush, Riseup Labs, and GMI Cloud (2026).
Vendor risk: repricing, lost access, and indirect licensing
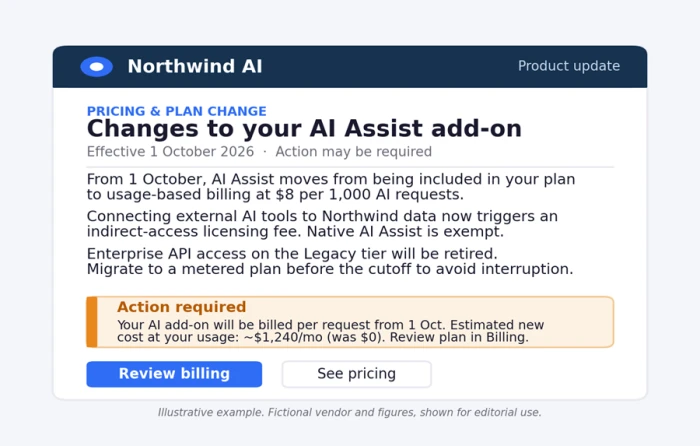
Your costs are not fully yours to control. Vendors reprice, and access can vanish mid-project. Enterprises building on Anthropic's Fable 5 lost access instantly when a U.S. export-control directive briefly suspended the model in June 2026, then regained it days later once the controls were lifted. Ecosystem players are also repricing around AI value. SAP, for one, now charges indirect-access licensing when you connect external AI tools to its data, a cost that can push you toward native products whether you planned for it or not.
Shadow AI: the spend outside your dashboard
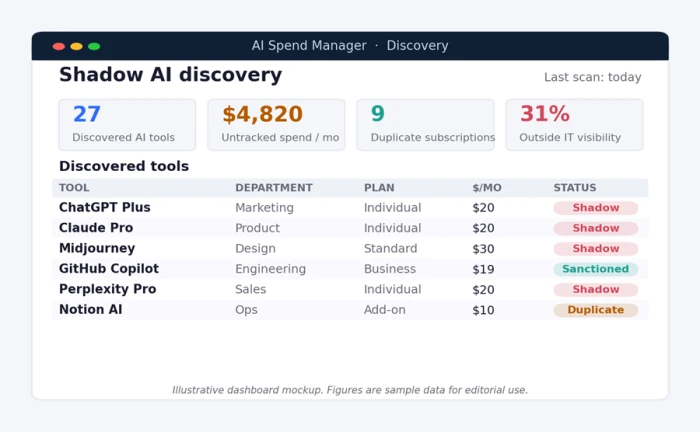
The cost you cannot see is often the fastest growing. Enterprise AI tool spending is rising near 40 percent a year, and Gartner estimates 25 to 35 percent of it happens entirely outside IT visibility. That sprawl is a budget problem before it is a security one. It creates duplicated subscriptions and untracked exposure with no shared measurement. IBM's 2026 breach research found that organizations with high levels of shadow AI faced materially higher breach costs, a premium of roughly $670,000 per incident over those without. Three $20 to $30 seats bought quietly by one employee already create $720 to $1,080 of annual cost before a single API call.
Does the ROI still hold once you scale?
All of this cost is only a problem if the value does not keep pace. The honest answer is that returns depend heavily on maturity, and the averages hide that. Companies with mature, scaled deployments report around $4.60 back per dollar. Teams still in pilot mode see closer to $1.20 or less. The gap between those two numbers is the entire risk.
Two facts make the scaling stage the danger zone. First, 58 percent of enterprises exceeded their AI infrastructure estimates by 40 percent or more, so the cost side routinely overshoots the plan. Second, pilot abandonment climbed sharply, with a large share of organizations dropping most of their AI initiatives before they reached production. ROI is real, and it lands mostly for teams that get past the pilot and control the curve rather than being surprised by it.
How to keep AI costs flat as you scale
Here is the encouraging part. The curve is steep, but it is also controllable, and the levers are well documented with real numbers. Done together, they let cost scale sub-linearly with usage. Start with architecture, because that is where the largest percentages live.
Architecture levers, ranked by impact
These techniques attack token consumption directly, and they stack.
● Model and cascade routing. route simple queries to small, cheap models and reserve frontier models for genuinely hard reasoning. RouteLLM cut costs over 85 percent while keeping 95 percent of GPT-4 quality; Stanford's FrugalGPT cascade reached up to 98 percent.
● Prompt caching. cache repeated context so you stop re-billing the same system prompt and history. Documented savings run 50 to 90 percent on repeated-context calls.
● Quantization. run smaller precision formats to cut serving cost 50 to 75 percent with minimal quality loss.
● Batch APIs. group non-urgent calls for a guaranteed discount, commonly around 50 percent.
● Prompt hygiene. shorten prompts, cap max output tokens, and strip dead context from multi-turn chats. Every 30 percent cut in prompt length cuts that cost 30 percent, one for one.
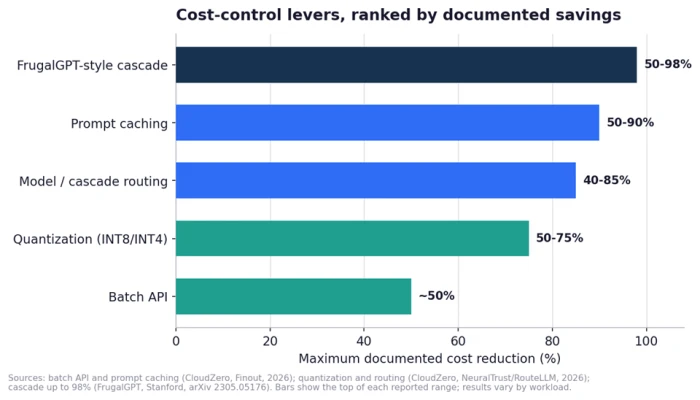
Figure 3. Maximum documented cost reduction by lever. Sources: CloudZero, NeuralTrust, and FrugalGPT (Stanford, 2023 to 2026).
Governance and FinOps levers
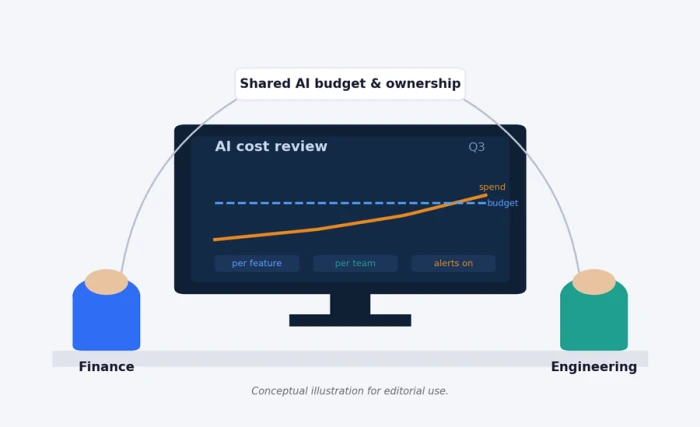
Architecture lowers the cost per call. Governance stops you from making calls you never needed and shows you where the money actually goes. Provider dashboards report account-level spend, not spend per team, per feature, or per customer, which is where the waste hides. A working AI FinOps setup adds a few habits worth more than their effort:
● Attribute cost per feature and per customer, not just per account, so you can see which workflow drives the bill.
● Set hard spending caps with alerts that fire before a runaway loop drains the budget.
● Run a quarterly license and seat audit; removing dormant seats is immediate savings with zero productivity hit.
● Give staff a fast, approved AI path. When Netskope studied enterprise AI gateways, shadow AI usage dropped from 47 percent to 12 percent within 90 days, because the sanctioned route became easier than the workaround.
Forecast it before you commit
Every section so far points to one habit that separates teams that control AI cost from teams that get surprised by it: they price the whole curve before they sign, not the entry tier. Pressure-test any vendor's number against the full stack of spend.
A before-you-scale cost audit
● Model your projected token volume at real production traffic, not pilot traffic.
● Add integration and data-cleanup hours at your loaded engineering rate.
● Budget 15 to 30 percent of build cost per year for maintenance and retraining.
● Include monitoring, guardrails, and a cost-attribution tool as recurring lines.
● Stress the pricing model against your real adoption rate, then recompute cost per active user.
● Ask the vendor directly how the bill behaves if usage triples, and get the answer in writing.
The one line to remember: the entry price is a marketing number. The exit price is an engineering-and-pricing decision you control. Teams that treat AI cost as an architecture problem keep the curve flat. Teams that treat it as a line item watch it bend.
The Bottom Line
AI cost is not a mystery. It is a curve, and the curve is knowable before you ever sign.
Every problem in this guide traces back to the same mistake: reading the entry price as the real price. The $20 seat, the $500 pilot, the quiet chatbot in a corner of the product. Those are marketing numbers. They tell you what it costs when nothing is happening. The moment real usage arrives, tokens multiply, retries stack, agents fan out, and idle seats pile up, and the bill steps up 10 to 50 times while the code sits untouched.
The teams that stay flat do three things. They pick the pricing model that fits how their usage actually clusters, instead of the one that looked cheapest on the page. They attack cost at the architecture layer, where routing, caching, quantization, and batch APIs each cut real money by half or more. And they price the whole curve before they commit, then ask the vendor in writing what happens when usage triples.
The teams that get surprised do the opposite. They approve the sticker price, ship the feature, and meet the true cost on an invoice a quarter later.
So treat AI spend the way you treat any other engineering decision. Model it at production traffic, not pilot traffic. Watch cost per active user and cost per task, not cost per account. Put caps and alerts in front of the runaway loops before they run. Give your people a sanctioned path so the spend you cannot see stops growing at 40 percent a year.
The entry price is handed to you. The exit price is yours to design. Build for the curve, and it stays flat. Ignore it, and it bends right past your forecast.
Comments
Join the discussion and share your perspective.