


What Visme Does
Visme is a browser-based studio for building presentations, infographics, charts, documents, and interactive content from one editor. It grew out of an infographics tool and now aims at people who are not designers: marketers, teachers, nonprofit staff, and small teams who need output that looks professional without a designer on call.
The pitch is consolidation. Instead of building slides in one app and charts in another before laying out a one-pager somewhere else, Visme puts those jobs on a single canvas with a shared asset library and brand controls. Plans run from a free Basic tier through Starter at $12.25 per month per person and Business at $24.75, with an Enterprise tier quoted for larger teams.
What Happened When We Tested It
We ran the whole workflow on a free Basic account: build a chart, pull templates, embed outside media, record a narrated slide, publish, and try to download the result. The editor was more capable than a free tier usually is. The limits showed up later, and they clustered around getting work out of the product rather than making it.
Building a chart from live data
Test 01 . Live data charts
The infographic template library
Test 02 . Template library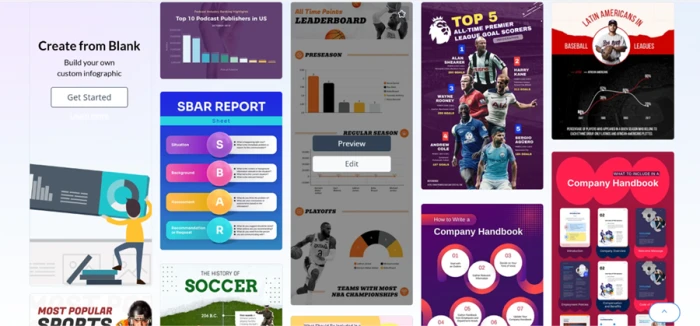
Pulling in a YouTube video
Test 03 . App embedding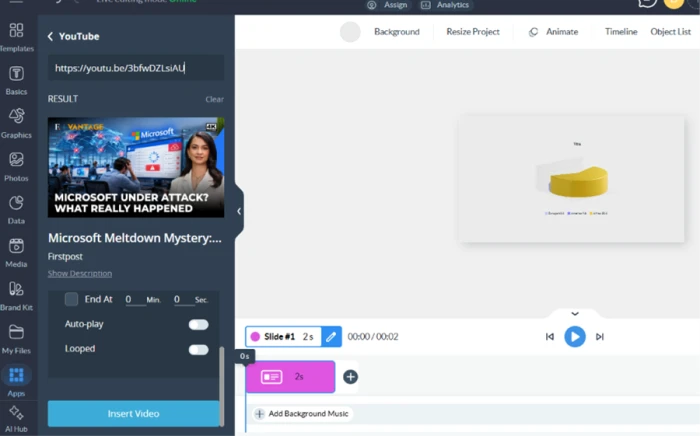
Playback on the canvas
Test 04 . Canvas playback
Recording a narrated slide
Test 05 . Recording limits
Publishing a shareable link
Test 06 . Publish gating
Downloading the finished work
Test 07 . Export paywall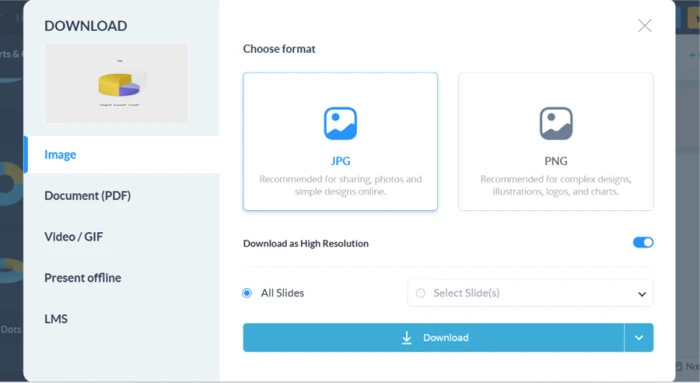
The two strongest moments came at no cost: a chart that redrew on every cell edit across five chart types, and an Apps panel that placed playable YouTube, Vimeo, Loom, and Wistia clips on the canvas without asking for an upgrade. The free editor is a real build environment, not a demo.
Every option in the Download window, from a plain PNG to PDF, sent me to the pricing page rather than my computer. You can build freely and publish a public link, but you cannot save the result offline, which turns the free tier into a trial with no takeaway.
10-Point Feature Review
Pros and Cons
- Live chart editing: type a value and the graph redraws on the spot, no re-render step
- Deep media embedding: drop playable clips from several video hosts plus forms and cloud files onto a slide
- Interactivity without plugins: animations and clickable elements come built into the editor
- Polished output for non-designers: first drafts tend to look finished, not rough
- Dense interface: the panel count and naming take time to learn before the tool feels quick
- Short recording window: Presenter Studio stops narrated takes well before a full talk ends
- Export friction: users report downloads that need workarounds and occasional content stability problems
- Occasional glitches: slides not loading and master-slide changes after updates come up in reviews
- Uneven AI help: the AI design suggestions miss often enough that some users ignore them
- Collaboration limits: teams flag thin organization and editing options for shared work
Pricing Breakdown
| Feature | Basic$0/year | Starter$147/yr ($12.25/mo) | Business$297/yr ($24.75/mo)Best Value | EnterpriseCustomfrom 10 users |
|---|---|---|---|---|
| JPG / PNG / PDF download | ✓ | ✓ | ✓ | ✓ |
| PPTX / HTML5 / Video / GIF export | ✗ | ✗ | ✓ | ✓ |
| Brand Kit & analytics | ✗ | ✗ | ✓ | ✓ |
| AI credits per month | 10 | 200 | 500 | Unlimited |
| Storage | 500MB | 1GB | 10GB | 25GB / user |
| SSO, 2FA & dedicated manager | ✗ | ✗ | ✗ | ✓ |
Where the value sits: The jump that matters is not Basic to Starter, it is Starter to Business. Paying for Starter still leaves you without PPTX, HTML5, or video export, so a presenter who needs a PowerPoint file has to reach the $297 tier to get one. Pricing is quoted per person, and the annual view is the only one the cards show by default under a 50 percent framing. Enterprise opens at ten seats. One detail users raise often: let a subscription lapse and you lose the ability to edit existing projects, so the cost is ongoing rather than one-time.
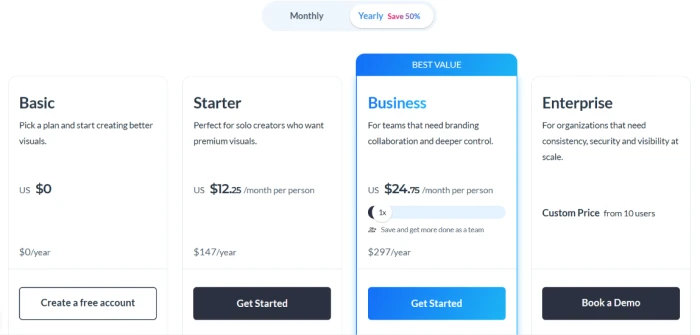
Pricing verified November 14, 2026. Figures move over time, so confirm the current rates on the official pricing page before you subscribe.
Visme vs the Top 3 Alternatives
| VVisme | PPiktochart | VVenngage | AAdobe Express | |
|---|---|---|---|---|
| Entry paid price | $12.25/mo per person | $10/mo per member, annual | $10/mo Premium | $9.99/mo Premium |
| Free plan | Yes, exports limited | Yes | Yes | Yes |
| Best For | Data-rich, interactive decks and infographics | Quick infographics and visual reports | Data-heavy business infographics | Fast social graphics in the Adobe stack |
| Core strength | Live charts, embedding, analytics | Low learning curve | Chart and diagram depth | Adobe assets and speed |
How to choose: Visme is the pick when the content is data-led and interactive, where its live charts and playable embeds, backed by viewer analytics, do work the others handle more lightly. Piktochart wins on a gentler ramp for one-off infographics. Venngage leans into dense data layouts, while Adobe Express is quickest for social output if you already live in Adobe's tools. Against Canva, the comparison most Visme users actually weigh, Visme trades a smaller stock asset library for stronger native charting and reporting, which is the reason data teams keep it on the shortlist.
Discussion
Join the discussion and share your perspective.